Disapointed by ChatGPT in Asking ChatGPT to Code a Plotting Function for Covering Diagrams but inspired by some of the diagrams in The Joy of Abstraction: An Exploration of Math, Category Theory, and Life by Eugenia Cheng, I decided to take a quick attempt at plotting Hasse diagrams for the factorization of positive integers.
1
2
3
4
5
6
7
8
9
10
11
12
13
14
15
16
17
18
19
20
21
22
23
24
25
26
27
28
29
30
31
32
33
34
35
36
37
38
39
40
41
42
43
44
45
46
47
48
49
50
51
52
53
54
55
56
57
58
59
60
61
62
63
64
65
66
67
68
69
70
71
72
73
74
75
76
77
78
79
from collections import Counter
from functools import reduce
from typing import Dict, Set
import matplotlib.pyplot as plt
import networkx as nx
import numpy as np
def factors(n: int) -> Set[int]:
"""
Compute the factors of a given number.
Parameters:
n (int): The number for which factors are to be computed.
Returns:
set[int]: A set containing the factors of the given number.
"""
return set(
reduce(
list.__add__,
([i, n // i] for i in range(1, int(n**0.5) + 1) if n % i == 0),
)
)
def make_graph(x: int) -> nx.DiGraph:
"""
Create a directed graph based on the factors of a given number.
Parameters:
x (int): The number for which the graph is to be created.
Returns:
nx.DiGraph: A directed graph representing the relationships between factors, after transitive reduction.
"""
nodes = factors(x)
g = nx.DiGraph()
for ni in nodes:
for nj in nodes:
if ni != nj:
if not ni % nj:
g.add_edge(nj, ni)
g = nx.transitive_reduction(g)
return g
def pos_hasse(g: nx.DiGraph) -> Dict[int, np.ndarray]:
"""
Compute the positions of nodes in a Hasse diagram based on their grades.
Parameters:
g (nx.DiGraph): The directed graph representing the Hasse diagram.
Returns:
Dict[int, np.ndarray]: A dictionary mapping node IDs to their positions in the diagram.
"""
grades = nx.shortest_path_length(g, source=1)
grade_counts = Counter(grades.values())
pos = {}
for grade in set(grades.values()):
gnodes = [node for node in grades if grades[node] == grade]
gnodes = sorted(gnodes)
center = len(gnodes) / 2
for i, ni in enumerate(gnodes):
pos[ni] = np.array([i - center, grades[ni]])
return pos
if __name__ == "__main__":
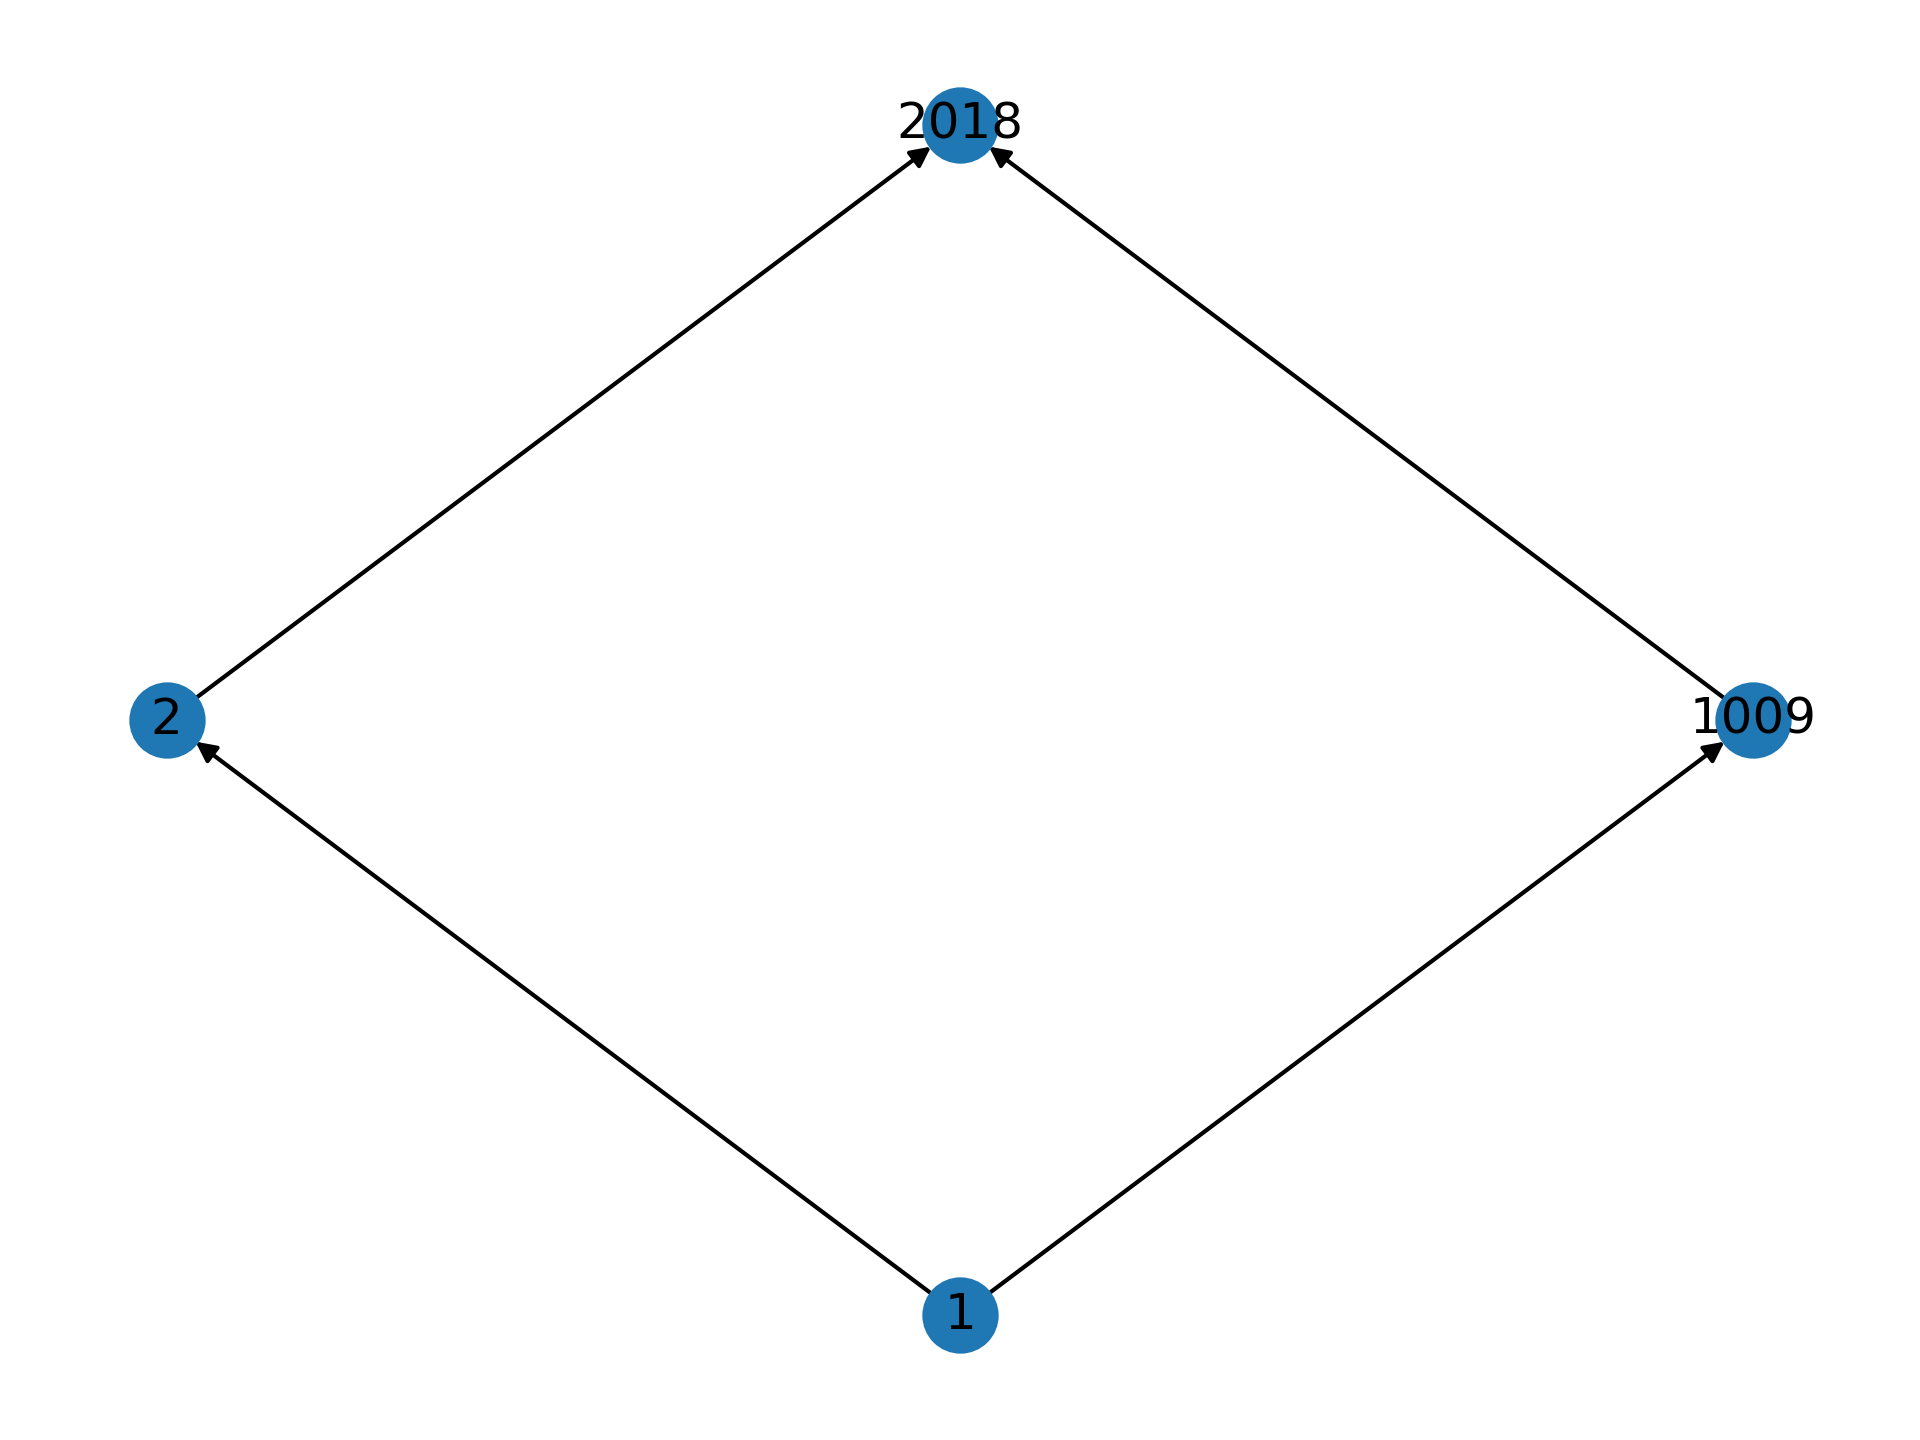
graph = make_graph(2018)
pos = pos_hasse(graph)
nx.draw(graph, pos=pos, with_labels=True)
plt.savefig('2023-06-10-hasse-diagram.png', dpi=300, transparent=True)
plt.close()
For the choice of integer 2018 given above we get the following diagram.