:dep petgraph = "*"
:dep petgraph-evcxr = "*"

extern crate petgraph;
use petgraph::graph::Graph;
use petgraph::dot::Dot;
use petgraph_evcxr::{draw_graph, draw_dot};Rendering a Dot Representation of a Graph in Quarto Using Petgraph and Petgraph-evcxr
Rust
Petgraph
Petgraph-evcxr
Dot
In this post I want to quickly showcase the use of the use of the Petgraph and Petgraph-evcxr packages. Petgraph is a popular graph data structures and algorithms crate available for Rust. Petgraph-evcxr is a tool that makes it possible to easily visualize graphs created using Petgraph within Jupyter notebooks. This in turn allows us to visualize such graphs within Quarto.
This we need to include them as dependencies.
Then we define the graph.
let mut g : Graph<&str, &str> = Graph::new();
let rock = g.add_node("Rock");
let paper = g.add_node("Paper");
let scissors = g.add_node("Scissors");

g.add_edge(rock, scissors, "beats");
g.add_edge(paper, rock, "beats");
g.add_edge(scissors, paper, "beats");
Finally, we call draw the graph.
draw_graph(&g);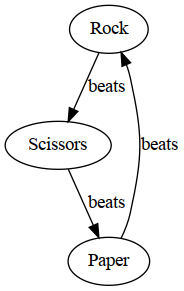
Mermaid is an easy alternative
One should be aware of the fact that it is easy to produce similar diagrams with Mermaid.
flowchart TD

Rock -->|Beats| Scissors
Paper -->|Beats| Rock
Scissors -->|Beats| Paper
flowchart TD Rock -->|Beats| Scissors Paper -->|Beats| Rock Scissors -->|Beats| Paper
Perhaps a small advantage of using Petgraph here is that you can programmatically generate the properties of the diagram, as other tools such as networkx would let us do. Above I just wanted to show that we ‘can’ produce such diagrams starting with Rust.