import ciw

ciw.seed(2018)

ARRIVAL_TIME = 1
SERVICE_TIME = 1 / 2
HORIZON = 365

network = ciw.create_network(
    arrival_distributions = [ciw.dists.Deterministic(ARRIVAL_TIME)],
    service_distributions = [ciw.dists.Exponential(SERVICE_TIME)],
    number_of_servers = [1]
    )

simulation = ciw.Simulation(network)
simulation.simulate_until_max_time(HORIZON)
records = simulation.get_all_records()Implementing a D/M/1 Queue in Ciw
Python
Discrete Event Simulation
Ciw
Queueing Network
Queueing System
Queueing Theory
Exponential Distribution
Statistics
Operations Research
Random Variables
Inter-Arrival Times
Service Times
Random Number Generation
Servers
Introduction
Ciw is a Python package for simulating queueing networks.
Simulation
A D/M/1 queue can be implemented and simulated using Ciw in the following way.
Results
We can tabulate the results.
from IPython.display import Markdown, display
import pandas as pd
records = pd.DataFrame(records)
display(
    Markdown(
        records
        [['waiting_time', 'service_time', 'queue_size_at_arrival', 'queue_size_at_departure']]
        .describe()
        .to_markdown()
        )
)| waiting_time | service_time | queue_size_at_arrival | queue_size_at_departure | |
|---|---|---|---|---|
| count | 183 | 183 | 183 | 183 |
| mean | 71.9111 | 1.96964 | 36.8087 | 73.3607 |
| std | 51.243 | 1.8815 | 25.7219 | 51.6083 |
| min | 0 | 0.0229044 | 0 | 0 |
| 25% | 19.1338 | 0.676208 | 13.5 | 20 |
| 50% | 75.1552 | 1.28472 | 34 | 76 |
| 75% | 111.045 | 2.53828 | 61 | 112 |
| max | 175.985 | 9.49261 | 80 | 179 |
We can plot the arrival times against the waiting times.
records.plot(x='arrival_date', y='waiting_time')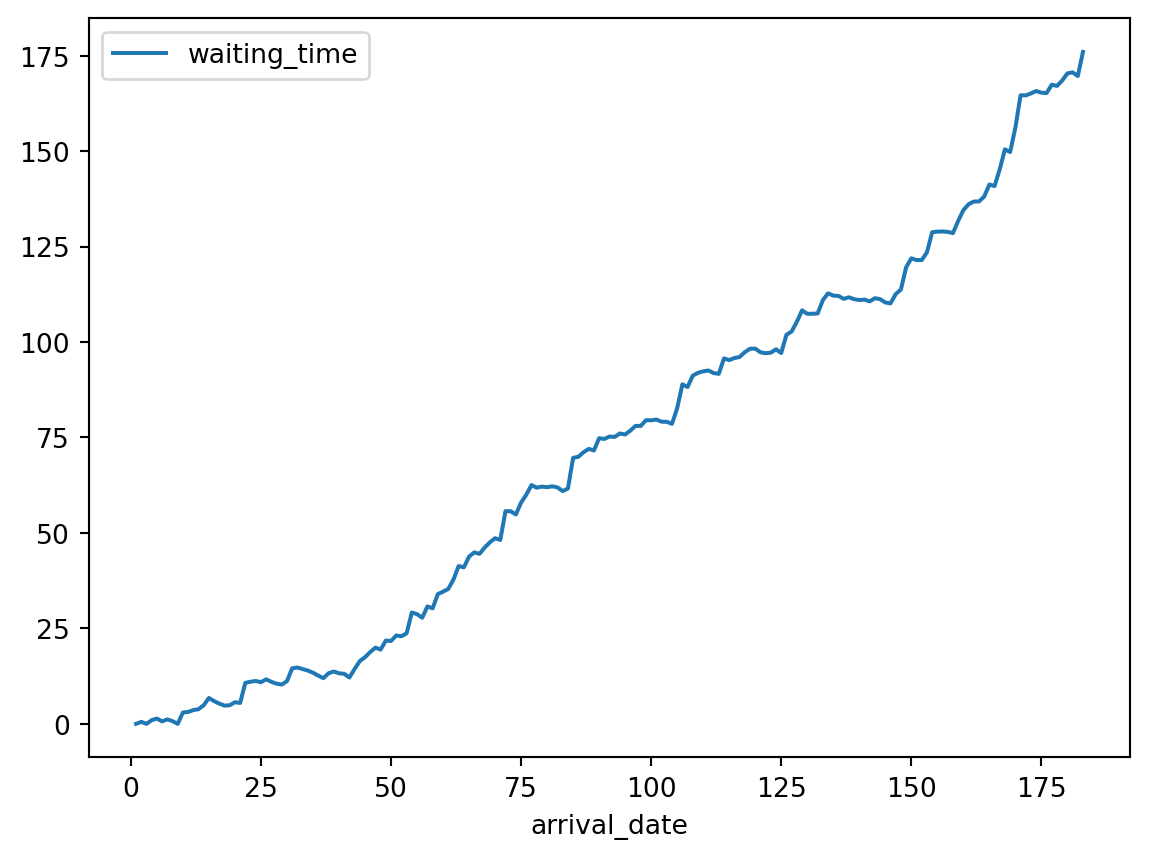
We can plot the service start times against the service times.
records.plot(x='service_start_date', y='service_time')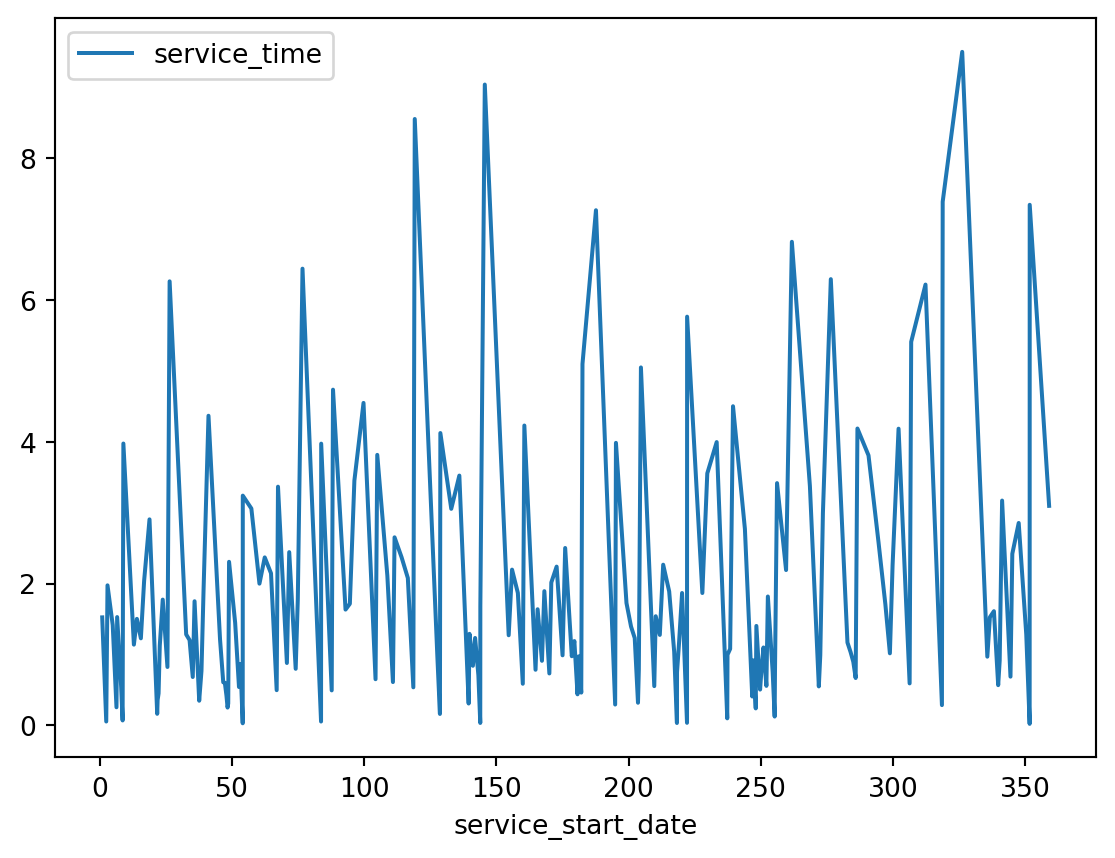
We can plot the arrival dates against the length of the queue when the customer arrived.
records.plot(x='arrival_date', y='queue_size_at_arrival')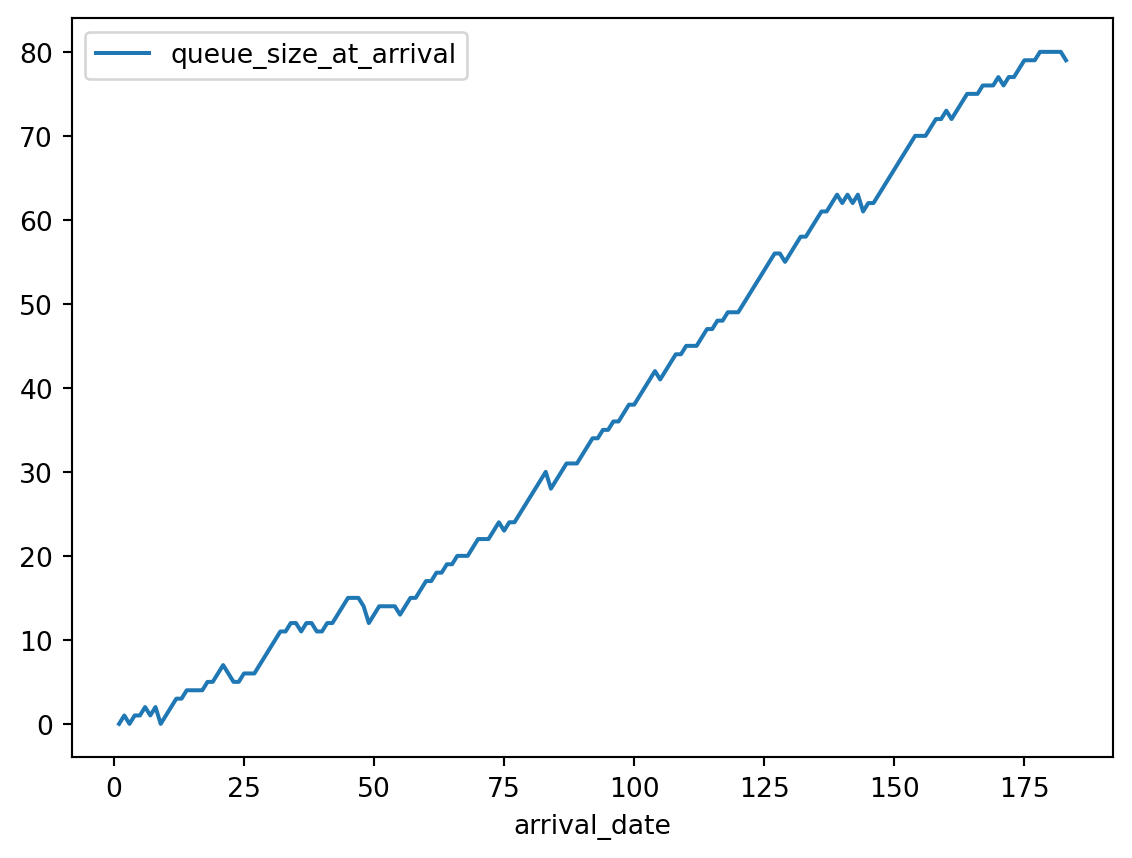
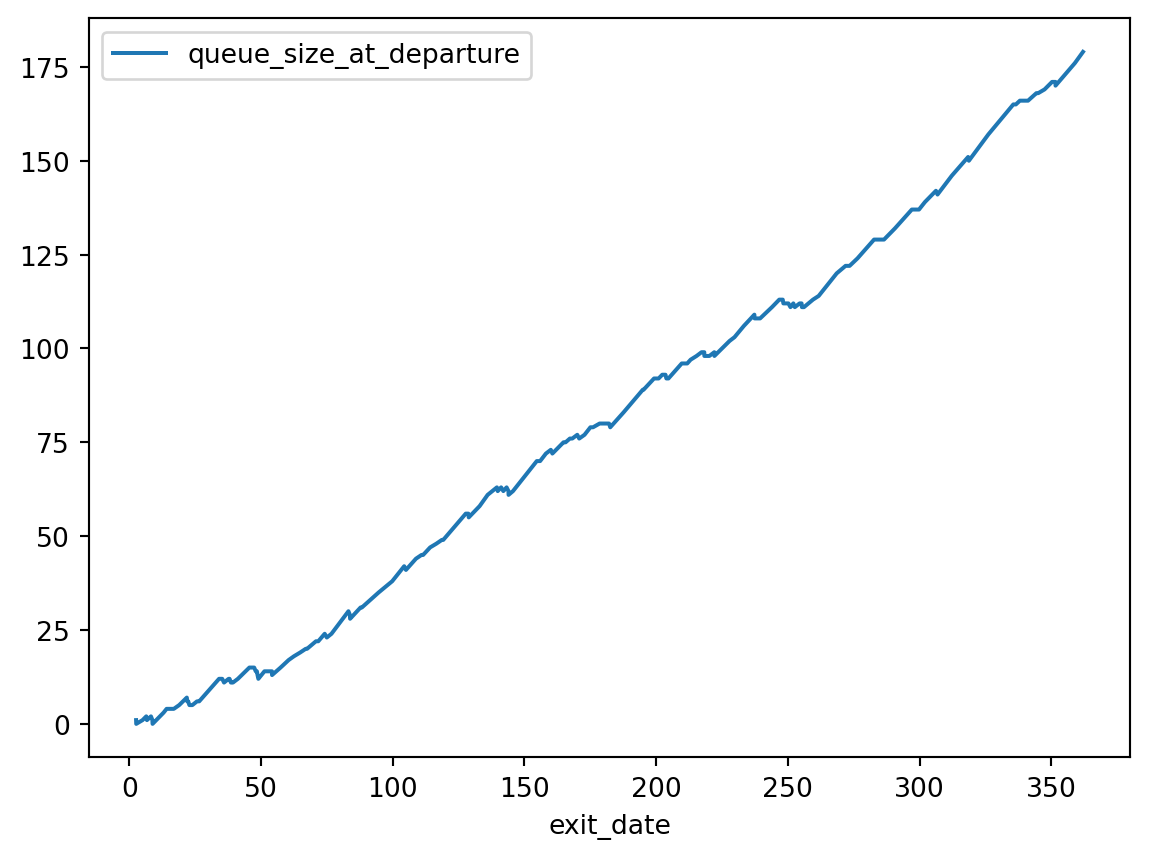
We can plot the departure dates against the length of the queue when the customer departed.
records.plot(x='exit_date', y='queue_size_at_departure')