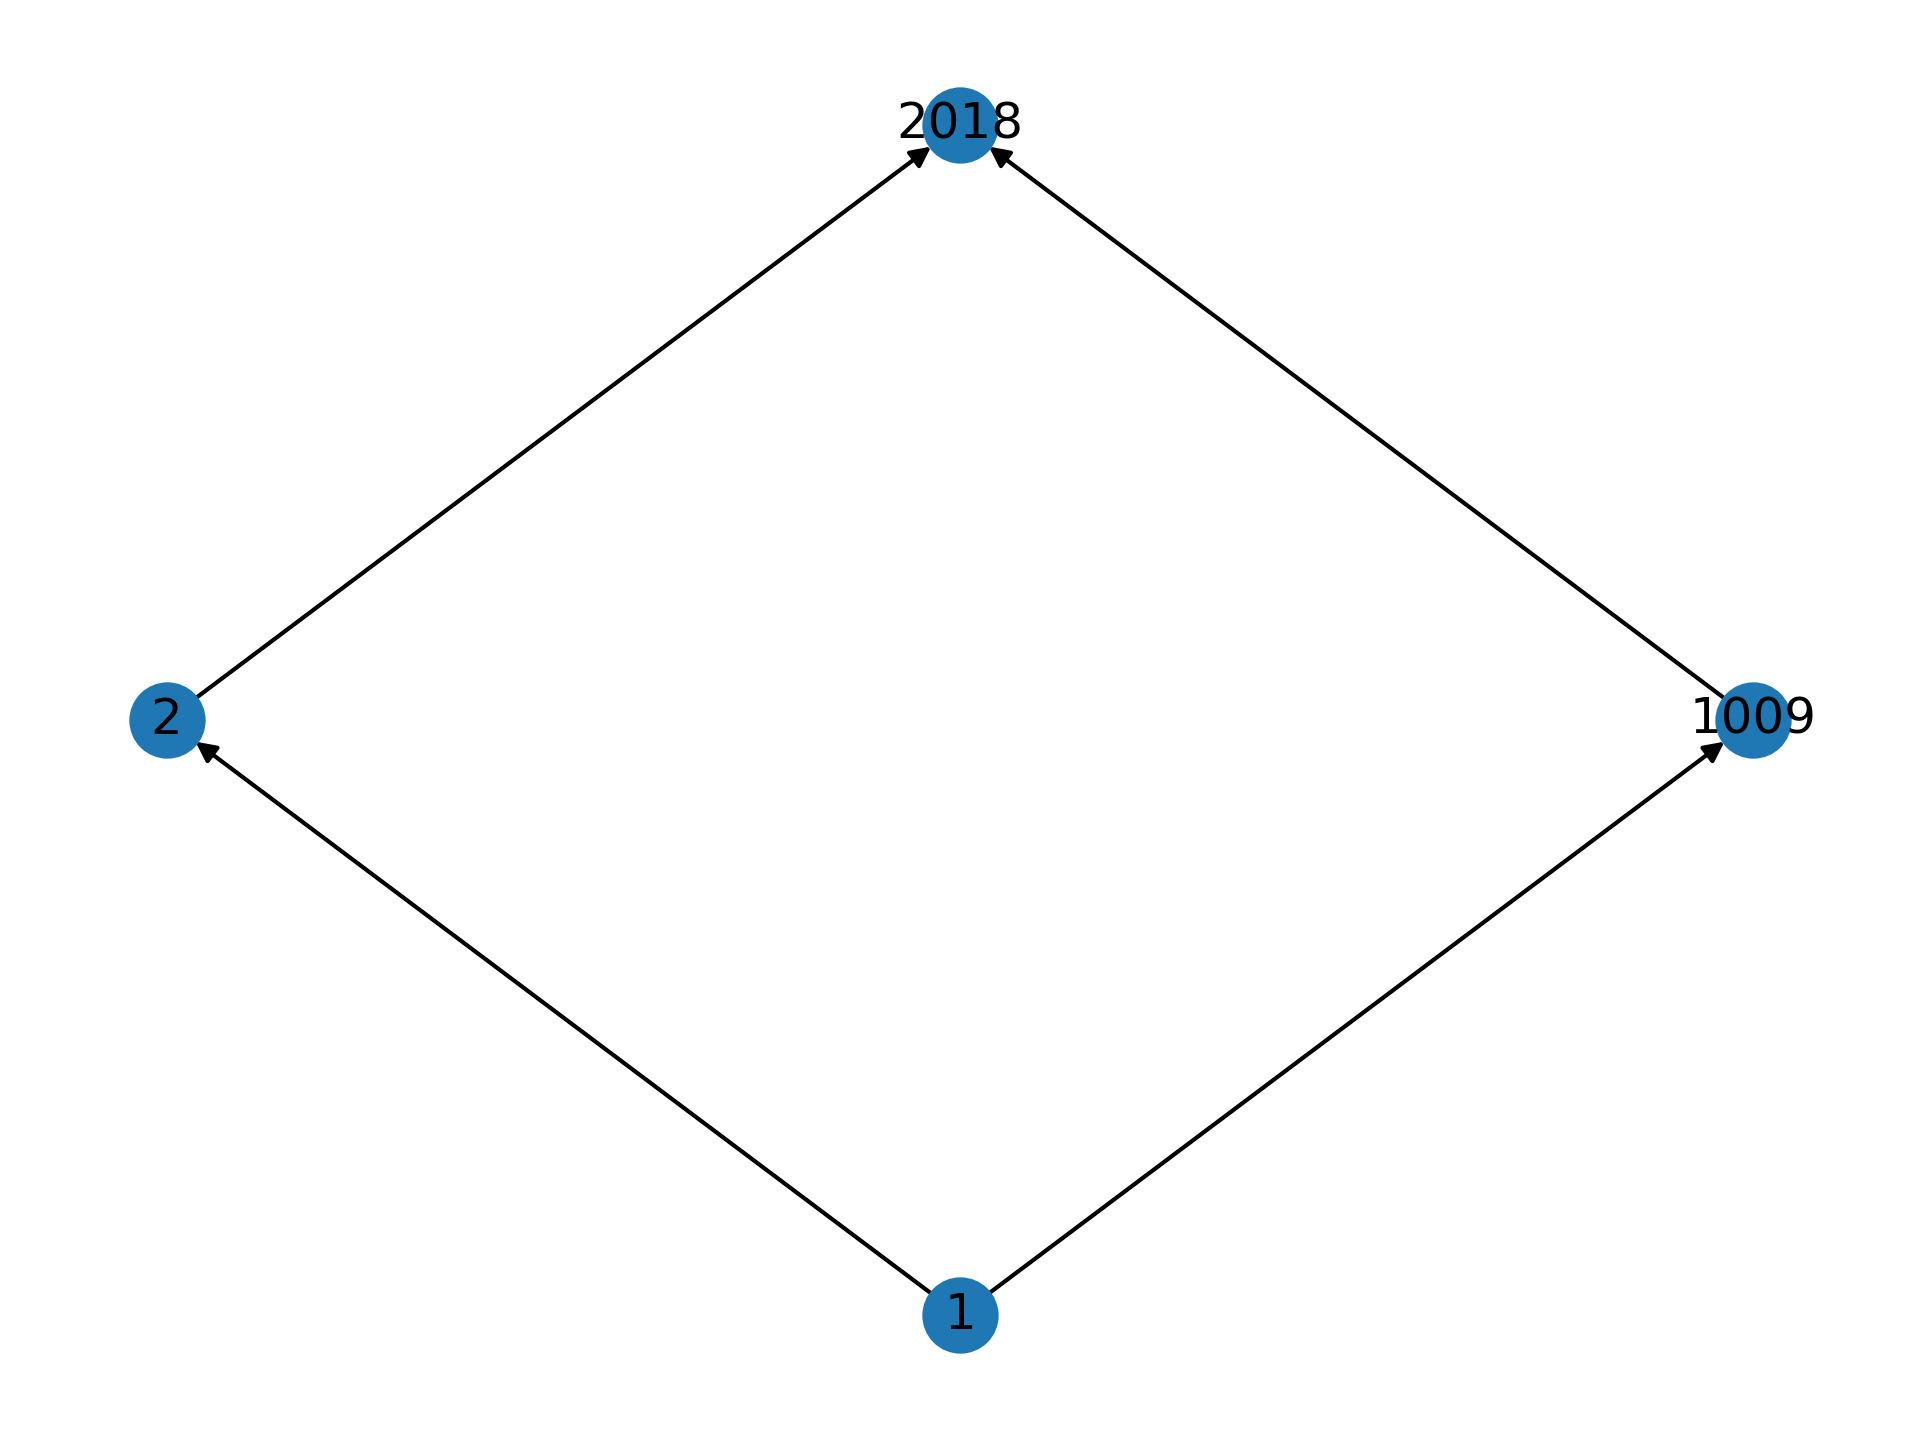
Disappointed by ChatGPT in Asking ChatGPT to Code a Plotting Function for Covering Diagrams but inspired by some of the diagrams in The Joy of Abstraction: An Exploration of Math, Category Theory, and Life by Eugenia Cheng, I decided to take a quick attempt at plotting Hasse diagrams for the factorization of positive integers.
from collections import Counter
from functools import reduce
from typing import Dict, Set

import matplotlib.pyplot as plt
import networkx as nx
import numpy as np


def factors(n: int) -> Set[int]:
    """Compute the factors of a given number."""
    return set(
        reduce(
            list.__add__,
            ([i, n // i] for i in range(1, int(n**0.5) + 1) if n % i == 0),
        )
    )


def make_graph(x: int) -> nx.DiGraph:
    """Create a directed graph based on the factors of a given number."""
    nodes = factors(x)
    g = nx.DiGraph()
    for ni in nodes:
        for nj in nodes:
            if ni != nj:
                if not ni % nj:
                    g.add_edge(nj, ni)
    g = nx.transitive_reduction(g)
    return g


def pos_hasse(g: nx.DiGraph) -> Dict[int, np.ndarray]:
    """Compute the positions of nodes in a Hasse diagram based on their grades."""
    grades = nx.shortest_path_length(g, source=1)
    grade_counts = Counter(grades.values())

    pos = {}

    for grade in set(grades.values()):
        gnodes = [node for node in grades if grades[node] == grade]
        gnodes = sorted(gnodes)
        center = len(gnodes) / 2
        for i, ni in enumerate(gnodes):
            pos[ni] = np.array([i - center, grades[ni]])

    return pos


def plot_hasse(n: int = 2018, output_path: str = "2023-06-10-hasse-diagram.png") -> str:
    """Plot Hasse diagram for number n and save to output_path."""
    graph = make_graph(n)
    pos = pos_hasse(graph)
    nx.draw(graph, pos=pos, with_labels=True)
    plt.savefig(output_path, dpi=300, transparent=True)
    plt.close()
    return output_path


def main() -> None:
    plot_hasse()


if __name__ == "__main__":
    main()
For the choice of integer 2018 given above we get the following diagram.