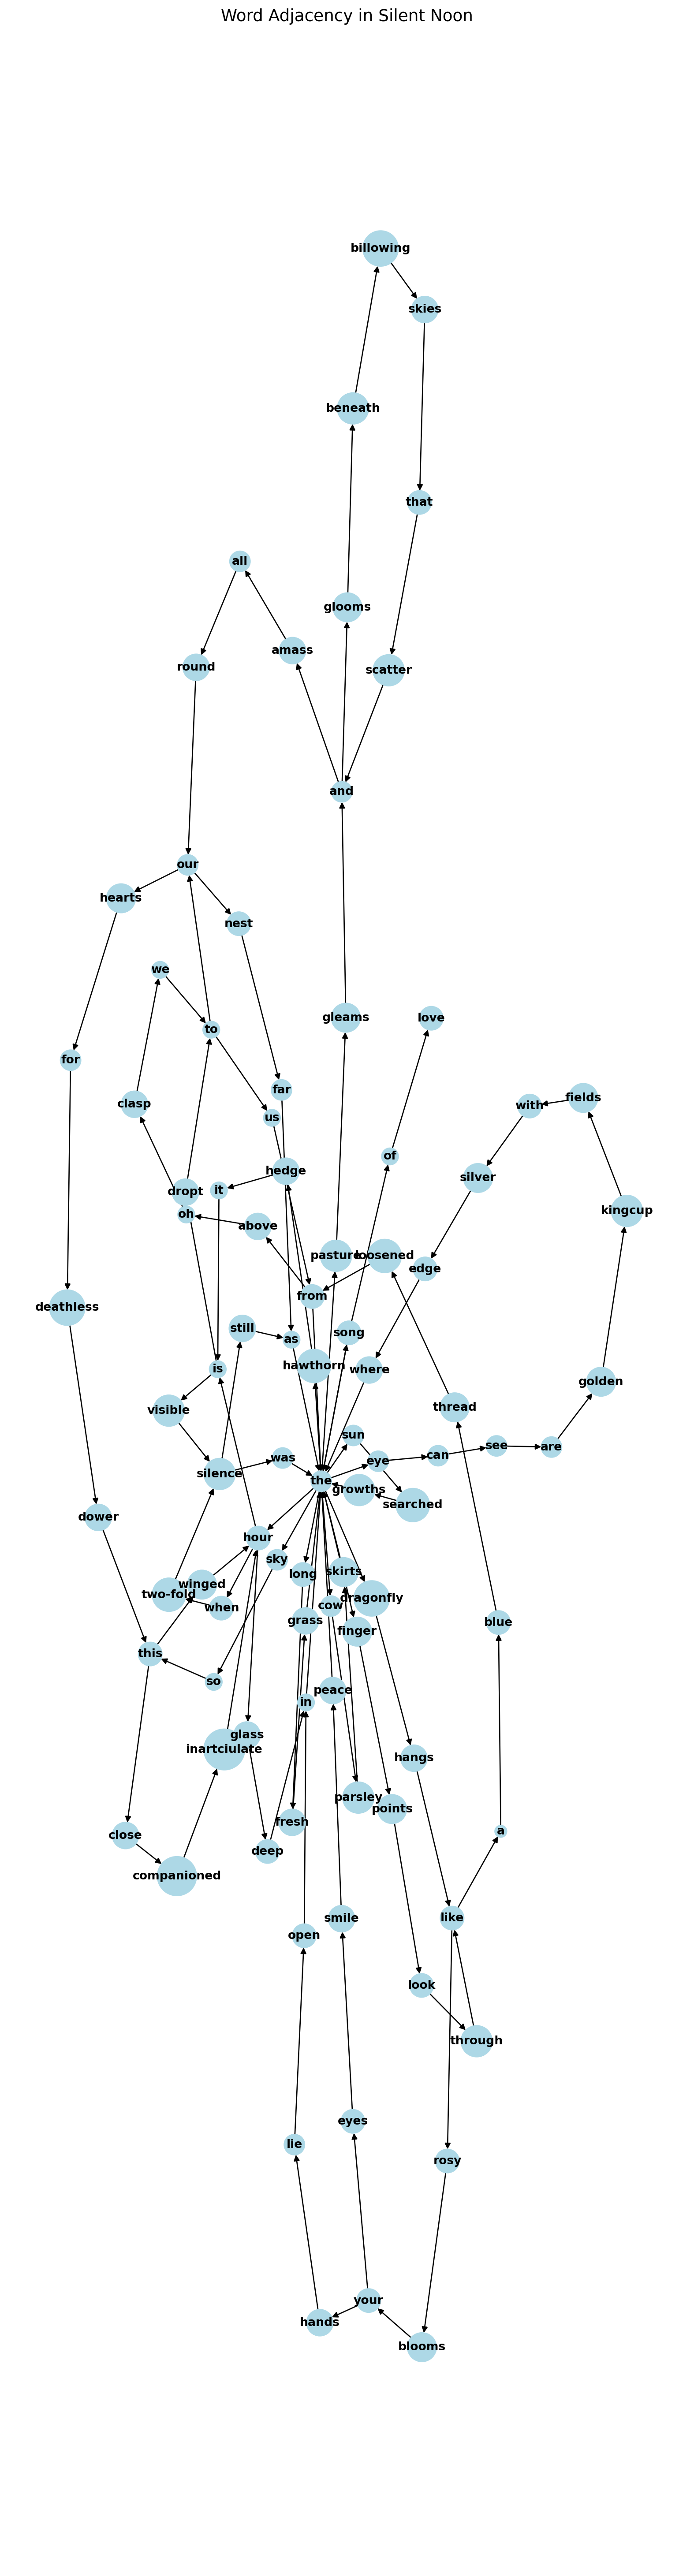
lyrics = """your hands lie open in the long fresh grass the finger points look through like rosy blooms your eyes smile peace the pasture gleams and glooms beneath billowing skies that scatter and amass all round our nest far as the eye can see are golden kingcup fields with silver edge where the cow parsley skirts the hawthorn hedge it is visible silence still as the hour glass deep in the sun searched growths the dragonfly hangs like a blue thread loosened from the sky so this winged hour is dropt to us from above oh clasp we to our hearts for deathless dower this close companioned inartciulate hour when two-fold silence was the song the song of love"""
lyrics = lyrics.split(' ')Word Adjacency Graph of Rossetti’s Silent Noon
Art
Music
Word Adjacency
Here are the lyrics of silent noon with punctuation and capitalization ignored:
import networkx as nx
import matplotlib.pyplot as plt

def create_graph(strings):
    # Initialize a directed graph
    G = nx.DiGraph()

    # Add each string as a node
    for s in strings:
        G.add_node(s)

    # Create edges based on adjacency (e.g., consecutive strings in the list)
    for i in range(len(strings) - 1):
        G.add_edge(strings[i], strings[i + 1])

    return G

def plot_graph(G):
    # Generate positions for nodes
    pos = nx.nx_agraph.graphviz_layout(G)

    node_sizes = [len(node) * 100 for node in G.nodes()]  # Adjust 100 to change the scaling factor

    # Draw the graph
    plt.figure(figsize=(8, 30))
    nx.draw(G, pos, with_labels=True, node_color="lightblue", font_size=10, node_size=node_sizes, font_weight="bold", arrows=True)
    plt.title("Word Adjacency in Silent Noon", fontsize=14)
    plt.show()

# Example usage
graph = create_graph(lyrics)
plot_graph(graph)