While looking into programmatically generating Sankey diagrams based on the results of discrete event simulations I made up a somewhat absurd programming exercise. Using matplotlib.sankey.Sankey you can draw a random walk as follows:
import matplotlib.pyplot as plt
from matplotlib.sankey import Sankey
import numpy as np

np.random.seed(2018)

sankey = Sankey()

for i in range(100):
    sankey.add(
        flows=[1, -1],
        orientations=np.random.randint(-1, 2, size=2).tolist(),
        prior=None if not i else i - 1,
        connect=None if not i else (1, 0),
        labels=None,
    )

sankey.finish()

plt.axis("off")

plt.tight_layout()

plt.savefig('sankey_random_walk.png', dpi=300, transparent=True)

plt.close()
Here is the plot:
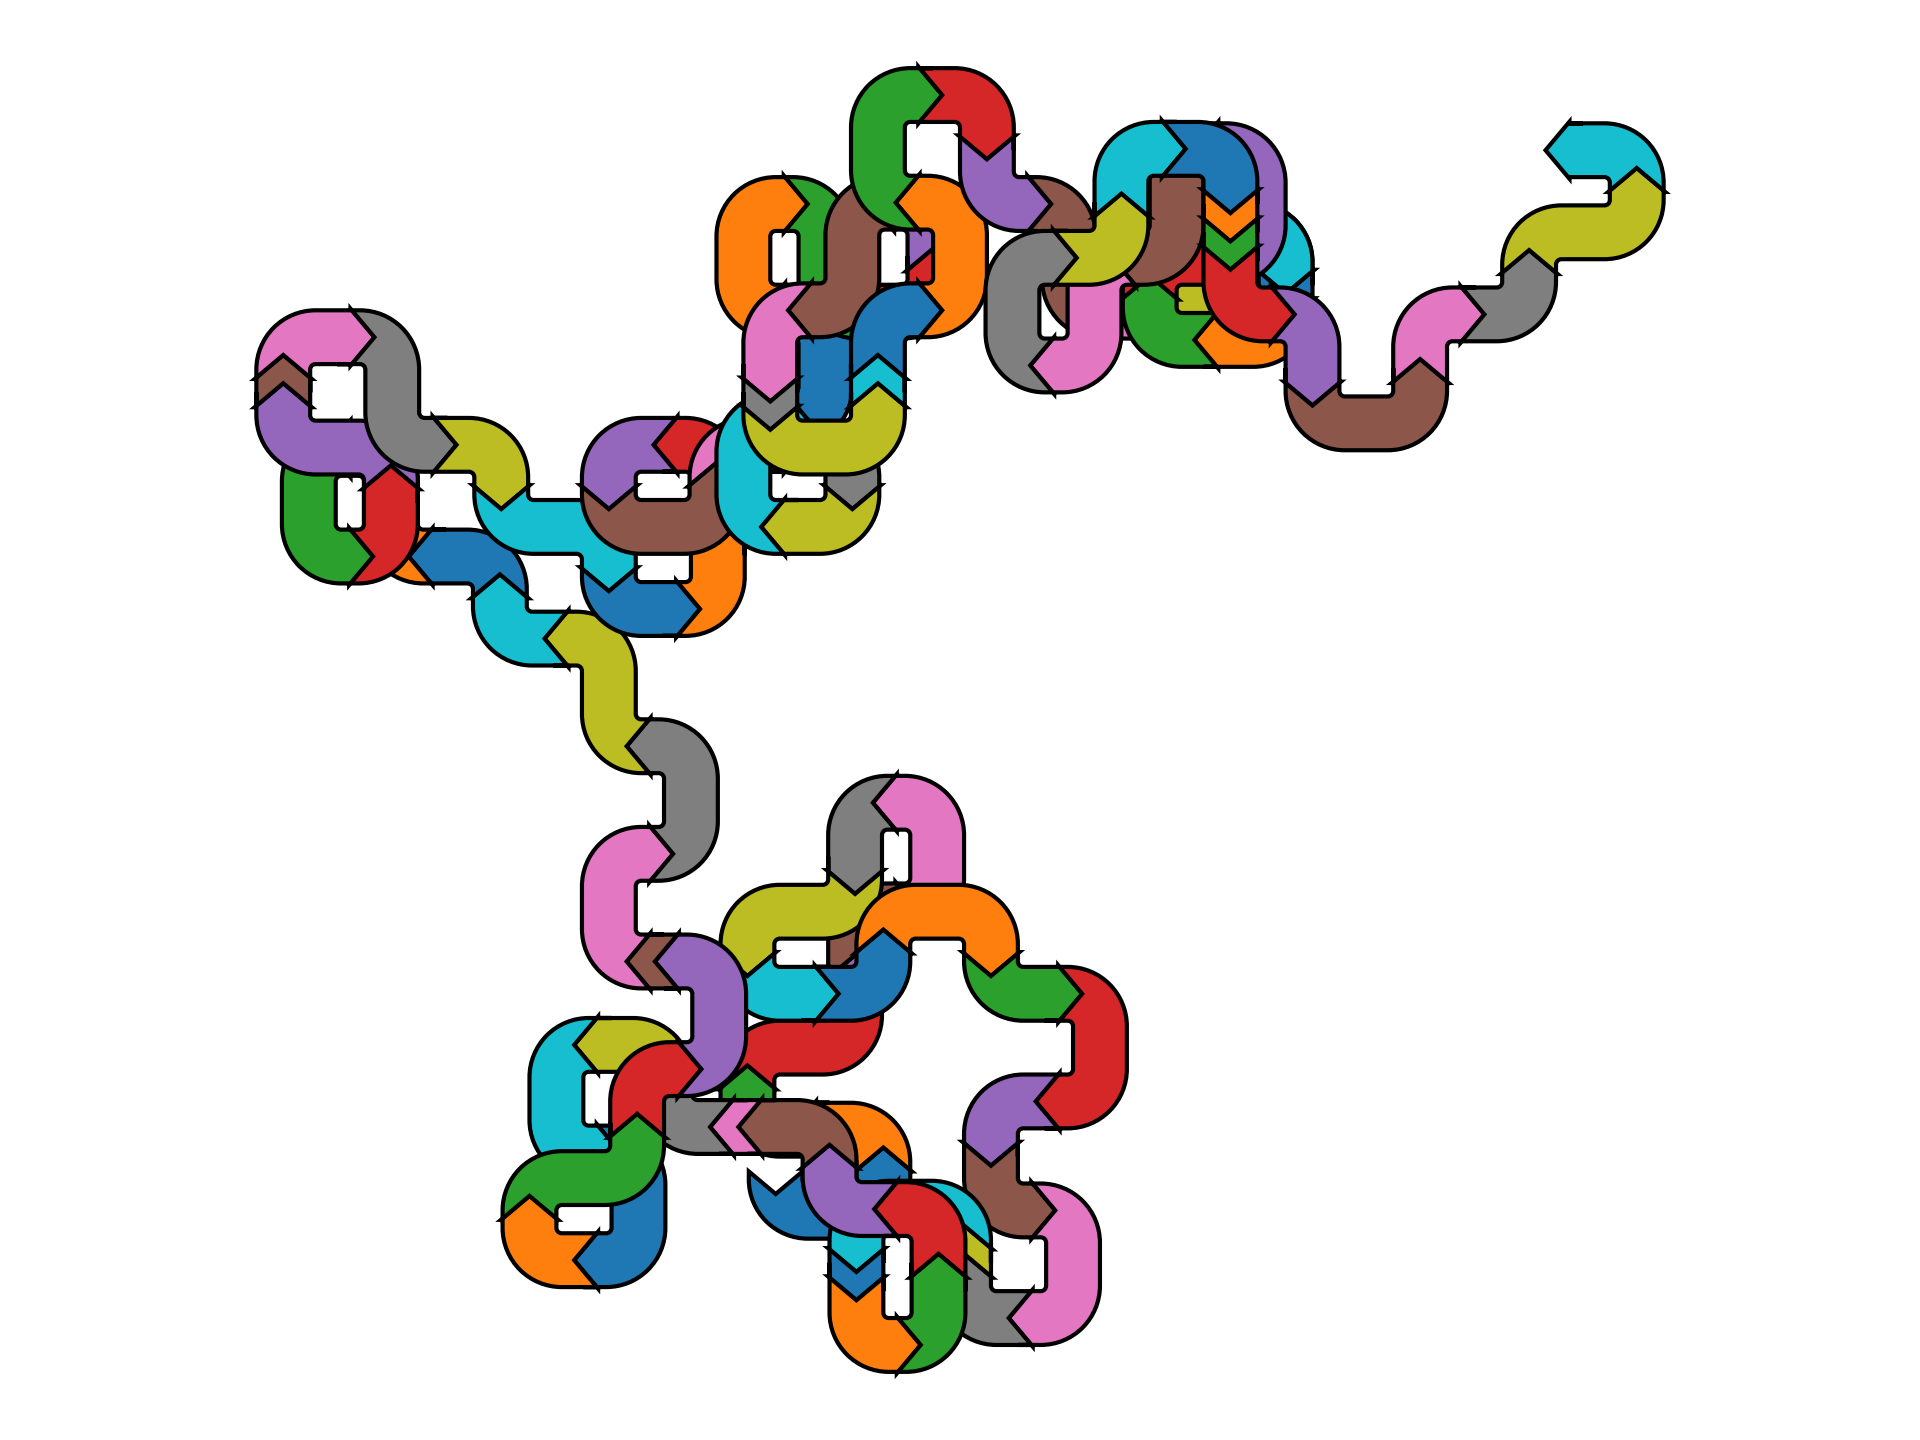
It is kind of pretty in my opinion.