I asked ChatGPT: > Write a Python script which takes a networkx.DiGraph object representing a partial order and plot it according to the rules of a covering diagram.
It responded by naming the chat session “Partial Order Plotting” and gave the following response: > Sure, here’s a Python script that takes a networkx.DiGraph object representing a partial order and plots it according to the rules of a covering diagram using matplotlib library:
"""Plot a directed graph according to the rules of a covering diagram.

This is the code ChatGPT produced for the blog post
*Asking ChatGPT to Code a Plotting Function for Covering Diagrams*, kept
faithful to the original answer. The post goes on to show that the
function is *not* a correct covering-diagram plotter for general partial
orders; the package records the attempt so the critique can be checked
against a single source of truth.
"""

from __future__ import annotations

import matplotlib.pyplot as plt
import networkx as nx
from matplotlib.axes import Axes


def covering_diagram(dg: nx.DiGraph, ax: Axes | None = None) -> Axes:
    """Plot the directed graph according to the rules of a covering diagram.

    Parameters
    ----------
    dg : networkx.DiGraph
        The partial order to draw. Nodes are laid out one per level along
        the result of ``networkx.topological_sort``, and the edges that the
        function believes to be covering relations are drawn in red.
    ax : matplotlib.axes.Axes, optional
        The axes to draw on. A new figure is created when this is omitted,
        which makes the function usable both standalone and as one panel of
        a larger figure.

    Returns
    -------
    matplotlib.axes.Axes
        The axes the graph was drawn on, so callers can save or annotate it.
    """
    levels = list(nx.topological_sort(dg))
    pos = {}
    for i, level in enumerate(levels):
        for j, node in enumerate(level):
            pos[node] = (j, -i)

    # Create a list of edges to add for the covering relations
    edges = []
    for i in range(len(levels) - 1):
        for a in levels[i]:
            for b in levels[i + 1]:
                if set(dg.predecessors(b)).issubset(set(dg.predecessors(a))):
                    edges.append((a, b))

    # Create the plot
    if ax is None:
        _fig, ax = plt.subplots(figsize=(8, 8))
    nx.draw_networkx_nodes(dg, pos, node_color="white", node_size=1000, ax=ax)
    nx.draw_networkx_labels(dg, pos, ax=ax)
    nx.draw_networkx_edges(
        dg, pos, edgelist=dg.edges(), arrows=True, alpha=0.5, ax=ax
    )
    nx.draw_networkx_edges(
        dg, pos, edgelist=edges, edge_color="r", arrows=True, alpha=0.5, ax=ax
    )
    ax.axis("off")
    return ax
This function takes a
networkx.DiGraphobjectdgas input, and it computes the levels of the partial order usingnx.topological_sort(). It then assigns positions to the nodes based on their level and position within the level, and adds edges for the covering relations. Finally, it uses matplotlib to plot the graph with the covering relations highlighted in red. You can call this function with yournetworkx.DiGraphobject as follows:
"""The full worked example partial order from the blog post."""

from __future__ import annotations

from pathlib import Path

import matplotlib.pyplot as plt
import networkx as nx

from chatgpt_plot_covering_diagram.covering import covering_diagram


def full_example(
    output: str | Path = "figures/chatgpt_cover_relation_plotter_output.png",
) -> Path:
    """Draw the full worked example from the post and save it.

    Parameters
    ----------
    output : str or pathlib.Path
        Destination of the rendered PNG. Parent directories are created.

    Returns
    -------
    pathlib.Path
        The path that was written.
    """
    dg = nx.DiGraph()
    dg.add_nodes_from(["a", "b", "c", "d", "e", "f"])
    dg.add_edges_from(
        [
            ("a", "b"),
            ("a", "c"),
            ("a", "d"),
            ("b", "e"),
            ("c", "e"),
            ("d", "e"),
            ("e", "f"),
        ]
    )
    ax = covering_diagram(dg)

    output_path = Path(output)
    output_path.parent.mkdir(parents=True, exist_ok=True)
    ax.figure.savefig(output_path, dpi=300, transparent=True)
    plt.close(ax.figure)
    return output_path


def main() -> None:
    """Console-script entry point: render the full worked example."""
    full_example()


if __name__ == "__main__":
    main()
This will create a plot of the partial order with a covering diagram.
After checking through the code for anything looking dangerous, I ran the code and it produced the following output: 
As people like to say about ChatGPT, it is both impressive and imperfect. Let’s go over some of it.
The first thing that struck me as odd was that it chose a total (i.e. linear) order. I would have been interested in seeing more arboricity in structure.
I also don’t see why running dg.add_nodes_from(['a', 'b', 'c', 'd', 'e', 'f']) makes any sense if you are going to run dg.add_edges_from([('a', 'b'), ('a', 'c'), ('a', 'd'), ('b', 'e'), ('c', 'e'), ('d', 'e'), ('e', 'f')]) because NetworkX will actually add the needed nodes as it adds the edges.
Using plt.show is common for quick little plots, which I guess wasn’t prohibited from what I asked. But I would rather that it return a matplotlib.pyplot.axis object, or receive an axis object as a parameter to covering_diagram.
It is completely reasonable that neither ChatGPT nor a human would account for an unstated preference that the output plot have a transparent background, which can be accomplished by passing transparent=True to the matplotlib.pyplot.savefig command. I can’t expect a machine to read my mind though! (Can I?)
And when it said “Finally, it uses matplotlib to plot the graph with the covering relations highlighted in red.” I was confused at first. But yes, some of the edges are coloured red according to whether it thought they were part of the covering relation on the input set.
It is appreciated that it attempted a docstring that seems to describe the general description of what the function is supposed to accomplish, but I didn’t like that it said nothing about the parameters. Without context, how would I know what dg is supposed to be?
Offhand I don’t know if the function is correct, but I would like to try some test cases on it.
Before doing that, I will replace plt.show() with plt.savefig('chatgpt_cover_relation_plotter_output_test.png', dpi=300, transparent=True) so I can comfortably embed the output on this blog post. And now let us run this case
"""The smaller partial order the post uses as a failing test case."""

from __future__ import annotations

from pathlib import Path

import matplotlib.pyplot as plt
import networkx as nx

from chatgpt_plot_covering_diagram.covering import covering_diagram


def failing_example(
    output: str | Path = "figures/chatgpt_cover_relation_plotter_output_test.png",
) -> Path:
    """Draw the post's failing test case and save it.

    The post expects a diagram similar to ``example_cover_relation_diagram.png``
    but the function produces something else, which is the evidence for the
    author's conclusion that the code does not work.

    Parameters
    ----------
    output : str or pathlib.Path
        Destination of the rendered PNG. Parent directories are created.

    Returns
    -------
    pathlib.Path
        The path that was written.
    """
    dg = nx.DiGraph()
    dg.add_edges_from(
        [("a", "c"), ("a", "e"), ("b", "c"), ("b", "d"), ("b", "e"), ("d", "e")]
    )
    ax = covering_diagram(dg)

    output_path = Path(output)
    output_path.parent.mkdir(parents=True, exist_ok=True)
    ax.figure.savefig(output_path, dpi=300, transparent=True)
    plt.close(ax.figure)
    return output_path


if __name__ == "__main__":
    failing_example()
which should produce an output similar to this:
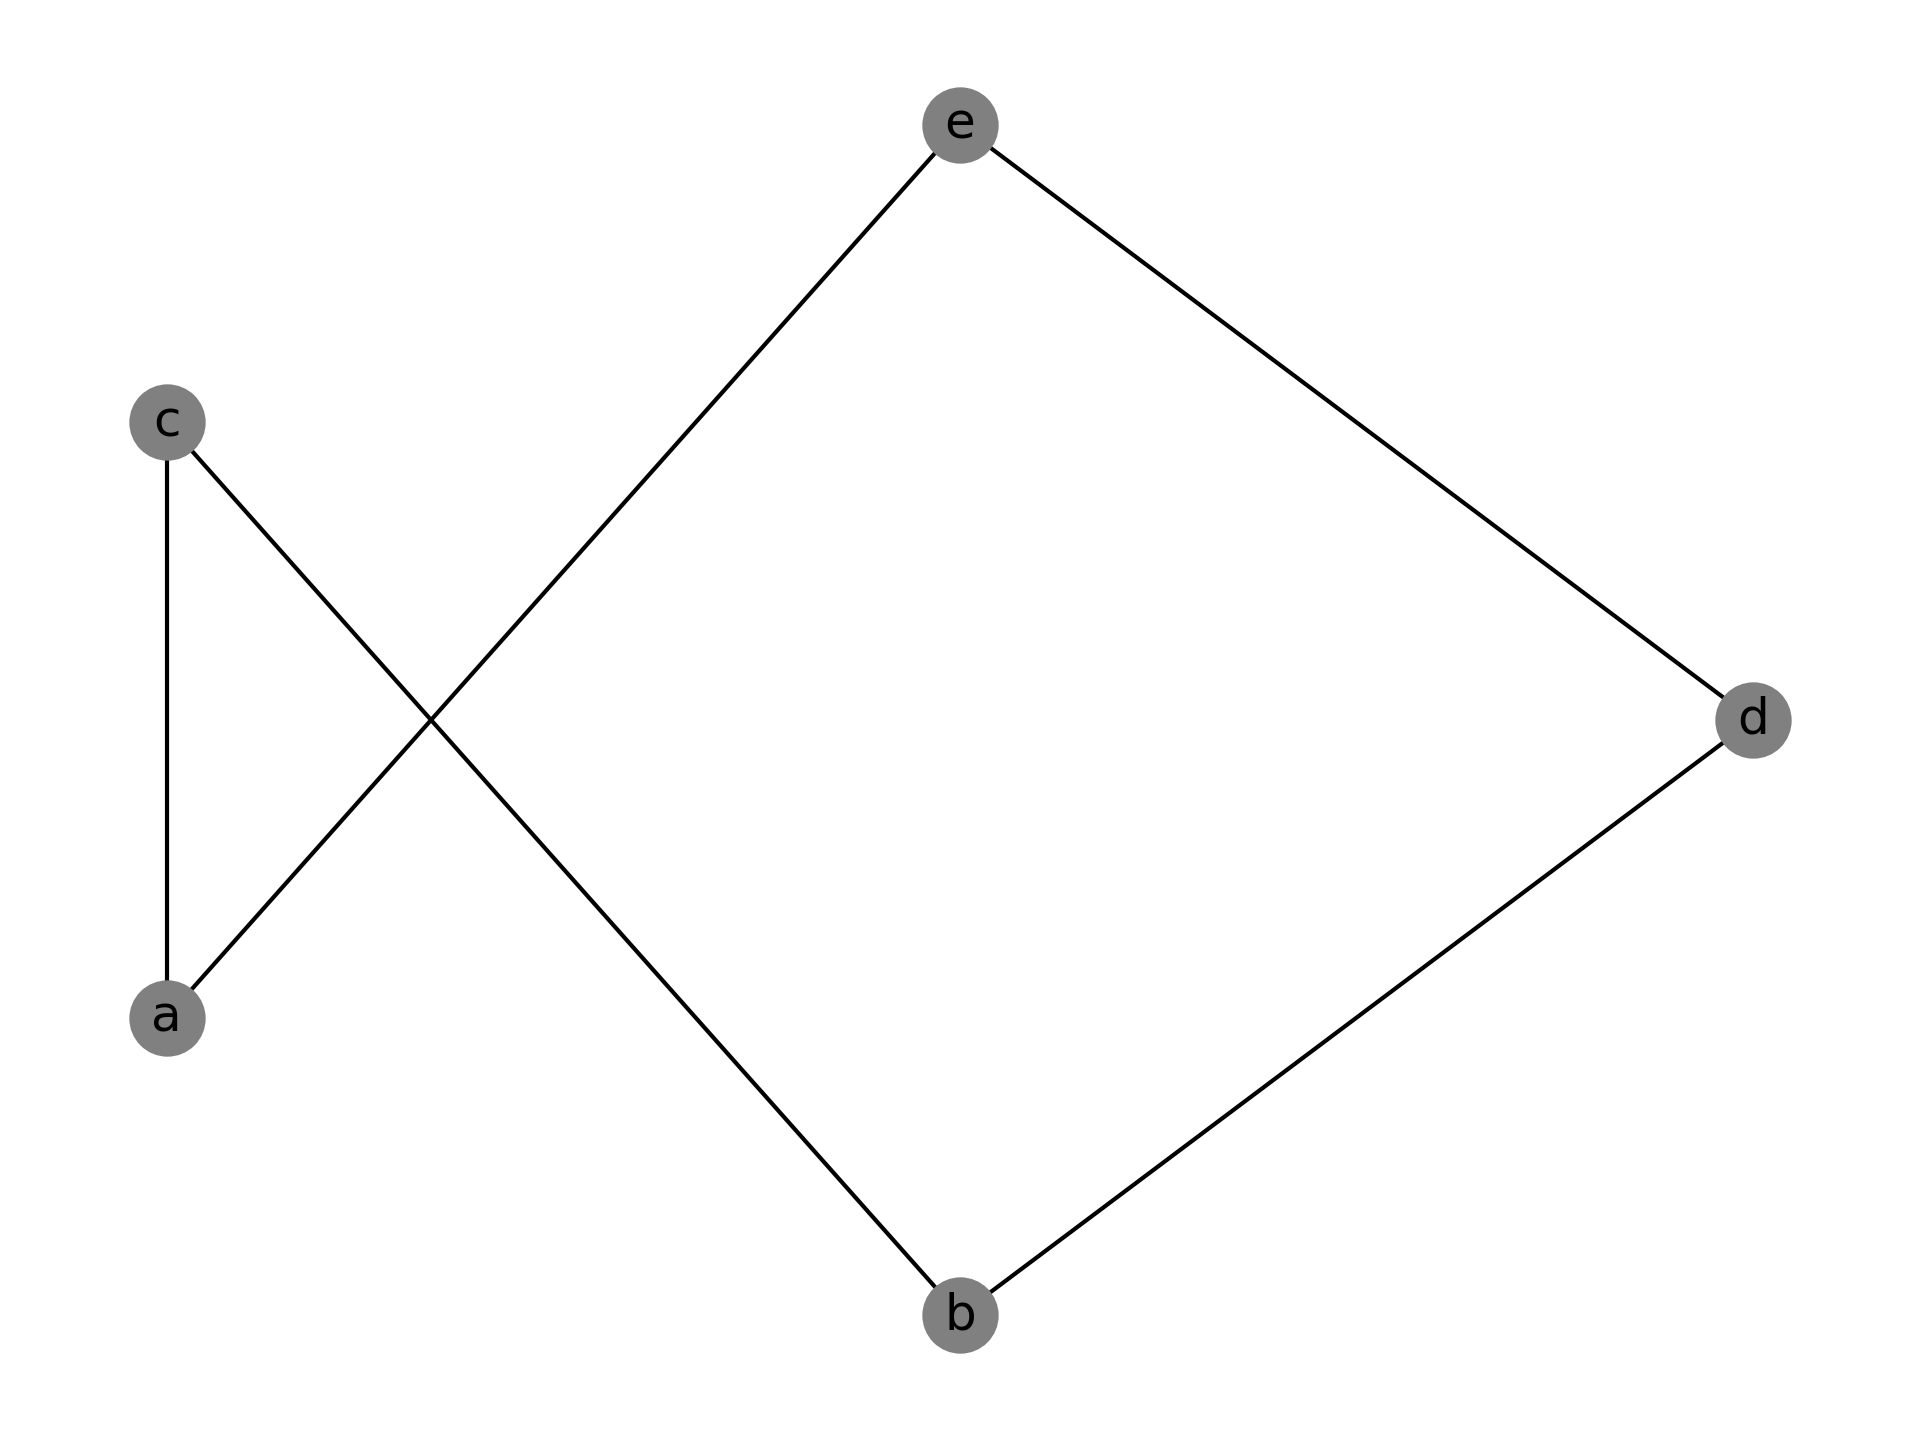
but instead it outputs this:
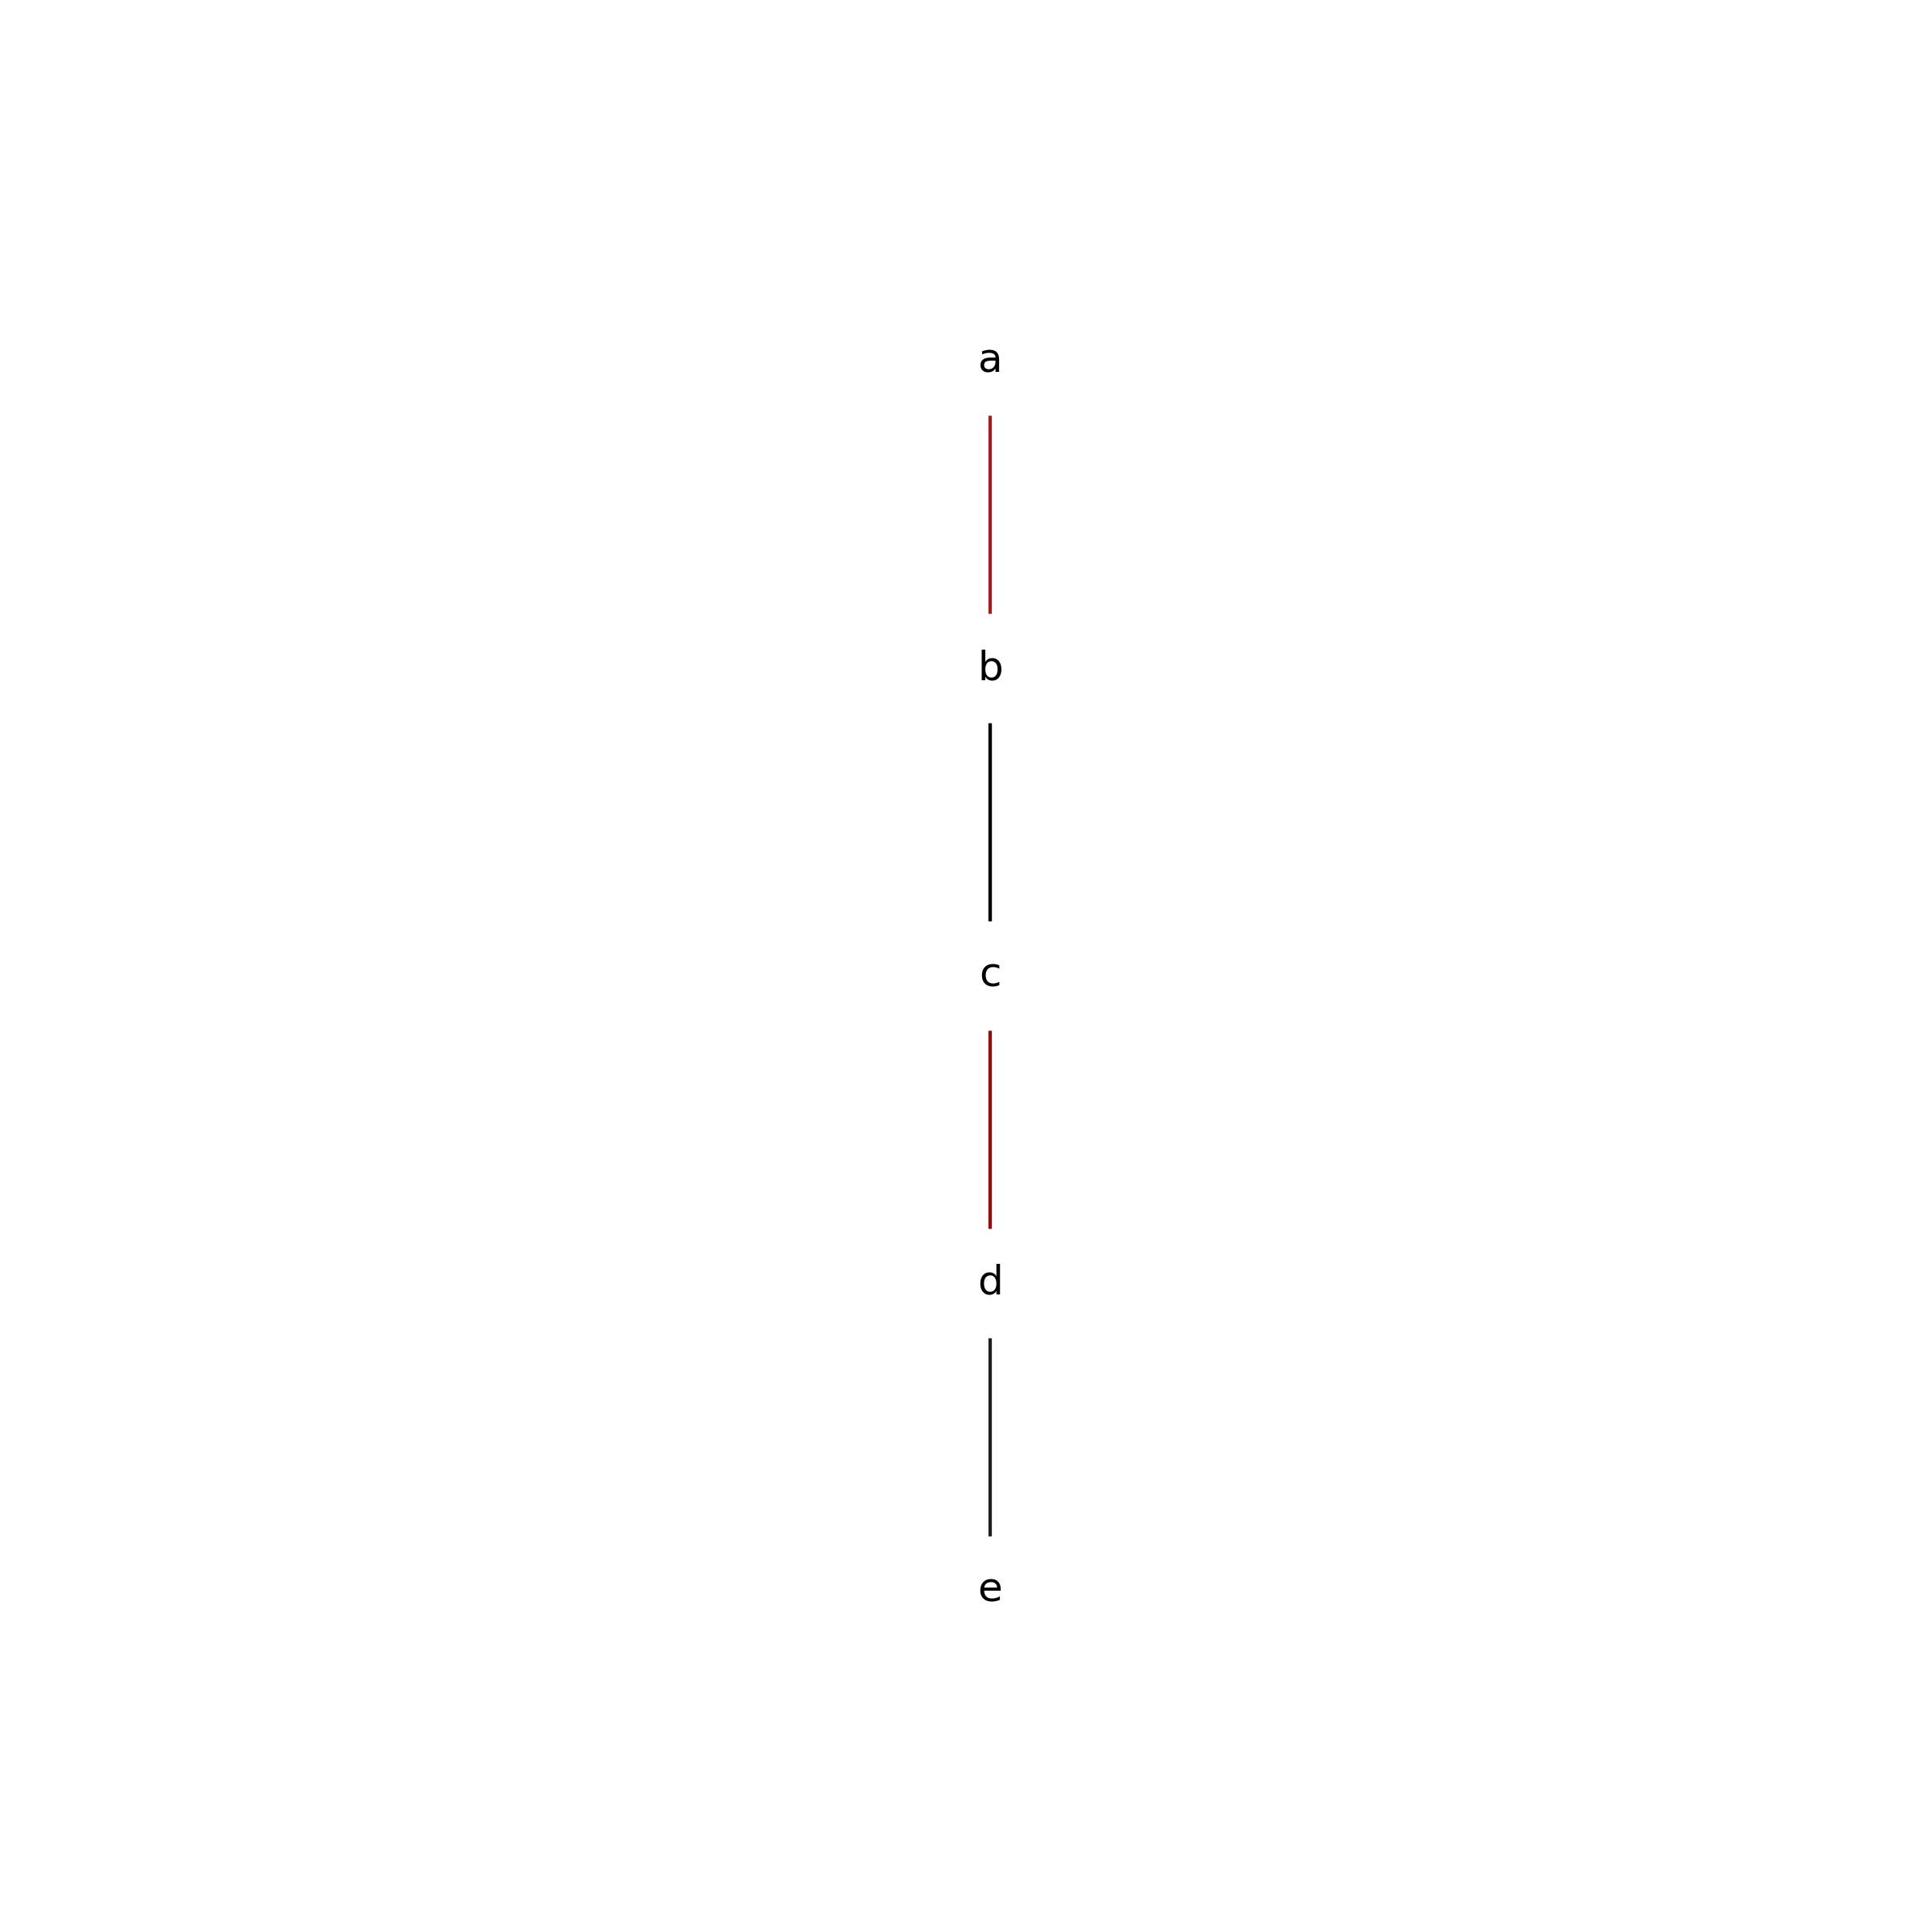
In conclusion, this code doesn’t work.